
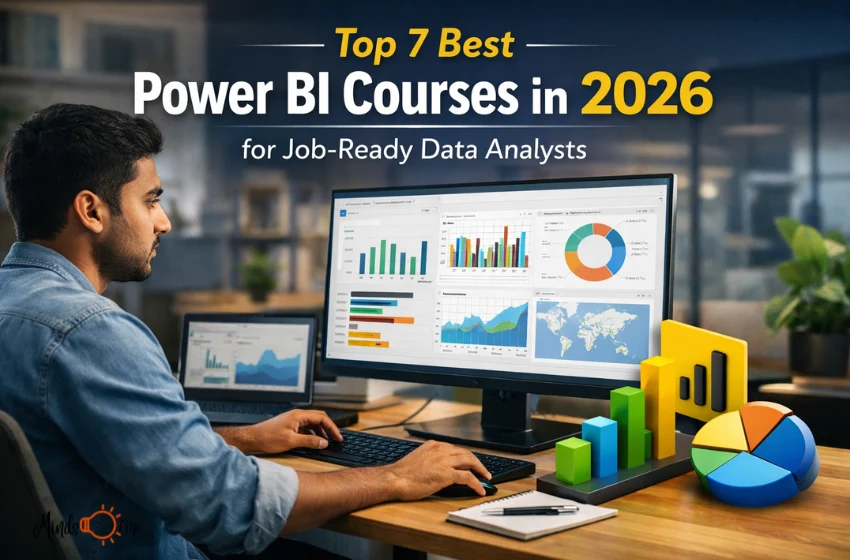
Power BI is how teams turn messy spreadsheets and scattered systems into reporting that leaders use. In 2026, hiring signals are simple: model data cleanly, write DAX that holds up, and ship dashboards people trust.
The seven picks below prioritize hands-on practice and publishable work. Choose one path, block out time each week, and finish with a dashboard and a short write-up. That proof travels well across interviews, reviews, and promotions.
Factors Need to Consider Before Choosing a Power BI Course
- Career goals matter because analysts need fast reporting, BI developers need governance, and managers need story-driven decision support daily.
- Experience level sets pacing since beginners need basics, while Excel or SQL users should focus on modeling and DAX depth.
- Learning style drives completion because cohort deadlines add structure, while self-paced formats require discipline and a clear weekly plan upfront.
- Portfolio requirements matter since recruiters want dashboards, documented measures, refresh logic, and commentary that mirrors real stakeholder questions at work.
- The time commitment should fit your calendar so you can practice consistently, finish projects, and retain skills under pressure in the long term.
Top Power BI Courses to Launch Your Career in 2026
1) Data Visualization and Analysis with Power BI, Great Learning Academy Pro+
Duration: About 11 hours
Offered by: Great Learning Academy Premium
Short overview
Great Learning Premium focuses on a practical power bi course covering Power BI data visualization from data loading through modeling, DAX basics, and report pages.
It includes one guided project that walks you step by step from understanding the dataset to insights and recommendations, helping you produce a portfolio-ready dashboard you can show in interviews.
Key highlights
- Must write about getting a certificate from Great Learning and access 20+ latest courses with Academy Pro.
- GL Coach provides instant clarification of doubts, curated materials, AI-assisted mock interviews, and a smart resume builder that highlights your new data science competencies to recruiters.
- Guided Project: FIFA 2018 Player Analysis focused on performance, wages, potential, and positional strengths.
- Step-by-step project guidance with starter templates and access to model solutions.
- Project certificate for each completed guided project to support resume and LinkedIn proof.
Learning outcomes
- Load and shape data for analysis
- Build a clean model and write core measures
- Design report pages that communicate insights clearly
- Complete a guided project and document findings
See Also : How Business Advisory Services Support Smarter Decision-Making for Modern Companies
2) Design and Manage Analytics Solutions Using Power BI Microsoft Learn Training Course
Duration: Typically delivered over 3 to 6 days
Offered by: Microsoft Learn Training
Short overview
This PL 300T00 course teaches how to prepare, model, visualize, and secure analytics solutions in Power BI.
Providers typically deliver it over three to six days, with structured labs that mirror workplace tasks. It suits learners who want a guided classroom cadence and a clear path into PL 300 readiness.
Key highlights
- Instructor-led delivery options from multiple training providers
- Focus on end-to-end analytics workflow, including security and management
- Built to align with PL 300 exam skills and job responsibilities
Learning outcomes
- Prepare and model data for enterprise reporting
- Build reports and manage assets in the service
- Apply security and governance basics confidently
3) Power BI Data Analyst Professional Certificate Coursera
Duration: About 5 months at 10 hours per week
Offered by: Coursera
Short overview
This Coursera certificate is an eight-course series designed for beginners who want job-ready Power BI skills.
It follows a flexible schedule and is completed in about 5 months, averaging about 10 hours per week. You practice data prep, modeling, and report design, and finish with a capstone project.
Key highlights
- Structured multi-course sequence with a capstone deliverable
- Flexible schedule that fits working professionals
- Shareable certificate for LinkedIn profile signaling
Learning outcomes
- Connect, transform, and model data for reporting
- Build dashboards that answer stakeholder questions
- Deliver a capstone project you can show as proof
4) Power BI Essential Training LinkedIn Learning
Duration: About 3 hours 34 minutes
Offered by: LinkedIn Learning
Short overview
Power BI Essential Training covers the core workflow in Power BI Desktop and the Power BI service.
In about three hours and thirty-four minutes, you move from importing data to building visuals and sharing outputs.
The format works well for professionals who prefer clear demos and quick practice today.
Key highlights
- Clear, practical demonstrations for the full workflow
- Fast completion time for quick momentum
- Certificate of completion for profile signaling
Learning outcomes
- Build a basic model and report layout
- Create visuals that support decisions
- Share outputs with the right context
5) Data Visualization with Power BI, Great Learning Academy Free
Duration: About 2 hours
Offered by: Great Learning Academy
Short overview
This power bi certification free introduces business intelligence basics, Power BI components, and building blocks like datasets, reports, dashboards, tiles, and simple DAX. A hands-on visual analytics demo, along with quizzes, helps reinforce learning.
It is designed for beginners and takes about 2 hours to complete at your own pace.
Key highlights
- Must write about getting a certificate from Great Learning and access 20+ latest courses with Academy Pro.
- GL Coach provides instant clarification of doubts, curated materials, AI-assisted mock interviews, and a smart resume builder that puts your new data science competencies in the spotlight for recruiters.
- Quizzes are included to test understanding as you progress.
- A certificate is available upon completion, with a separate certificate fee if you choose to claim it.
Learning outcomes
- Understand Power BI building blocks and terminology
- Create a simple report and dashboard flow
- Complete quizzes and validate fundamentals
See Also : Finnorth Explained A Modern Fintech Platform for Smarter Digital Finance
6) Data Analyst in Power BI Track DataCamp
Duration: About 48 hours
Offered by: DataCamp
Short overview
DataCamp offers a Data Analyst in Power BI track that combines structured courses with hands-on case studies and practical exercises..
It takes about 48 hours to complete and covers Power Query, modeling, DAX, report design, and deployment basics.
Case studies like churn and HR analytics help translate skills into workplace narratives.
Key highlights
- Sequenced curriculum from basics to report design and maintenance
- Case studies that simulate common analytics scenarios
- Completion credential you can add to LinkedIn
Learning outcomes
- Use Power Query for preparation and transformations
- Build measures and models that scale
- Create report pages with clear interaction patterns
7) Power BI Specialist Learning Path, Maven Analytics
Duration: About 74 hours
Offered by: Maven Analytics
Short overview
Maven Analytics Power BI Specialist is a learning path covering Power BI Desktop, the service, and advanced DAX. It lists seventy-four hours across four courses and includes two guided projects.
You learn data prep, modeling, report design, and governance features such as gateways, dataflows, and row-level security for teams.
Key highlights
- Long form path designed for consistent practice across weeks
- Two guided projects to turn skills into portfolio artifacts
- Coverage includes governance features used in production environments
Learning outcomes
- Build stronger DAX and modeling habits
- Publish and manage assets with governance in mind
- Complete guided projects suitable for a portfolio
Conclusion
Choose one course, schedule weekly study blocks, and finish. Build a dashboard that answers a business question, then write a README explaining measures and choices.
If you are new, start with a free option and other free online course, then move to programs for deeper practice. Publish work, collect feedback, and refine models until stakeholders trust your reports.
Your portfolio becomes the strongest proof for job moves and promotions. For more latest updates must visit Mindsflip.